March 2026
Last updated: April 6, 2026
Unwrap MCP: Bring Feedback Intelligence to Your AI Workflows
You can now connect Unwrap to Claude Code, Cursor, and other MCP-compatible AI tools. Our new Model Context Protocol (MCP) lets you query customer feedback, search taxonomy groups, and generate visualizations—all without leaving your development environment.
What you can do:
Search and analyze feedback entries using natural language
Identify top actionable groups driving customer pain points
Generate charts showing feedback trends over time
Query and filter by specific cohorts
Ask questions about your feedback and get AI-powered answers
You can answer questions like "What are the top complaints from enterprise customers this month?" or "Show me a chart of NPS detractor drivers" directly from your workspace.
To get started, follow the set-up instructions here.
Introducing Unwrap’s New Assistant
The upgraded Assistant is now live for all users. Rebuilt from the ground up and powered by Claude plus advanced new tools, the Assistant can now answer far more complex questions about your feedback. Understand root causes, ideate on solutions, and evaluate support effectiveness.
“Find the top root cause driving [problem] and help me prioritize solutions with verbatim evidence.”
“From feedback about [problem], what are three ideas to solve the problem at the root?”
“How is support handling [complaint type]?"
“What feedback has changed since [change] launched on [date]?”
Build More Accurate Groups with Assistant
Assistant now lets you build more nuanced Groups for your taxonomy by describing what the Group should be about in natural language.
For example, let’s say you have a Group tracking feedback about ‘withdrawing money to a bank account’. But it incorrectly includes feedback about withdrawing to prepaid cards. Now you can tell Assistant to ‘remove all feedback about withdrawing to prepaid cards”. The same can be done when making a new Group - give complex instructions to only what you care about, no matter how complex your rules are.
.gif")
New and Improved Taxonomy Page
The Explore Page is getting a new look. Now called the Taxonomy page, it has a cleaner design and more powerful navigation options.
You can now view your taxonomy in three different ways:
Outline view for a classic tree structure
Column view for fast, horizontal browsing through levels
Table view for sorting and filtering groups by any metric
Switch between these layout options based on how you prefer to work. Whether you're reviewing thousands of groups or drilling into a specific branch, the Taxonomy page adapts to how you explore.

Board Improvements
New Visualization Types
Two new visualization types are available in Boards.
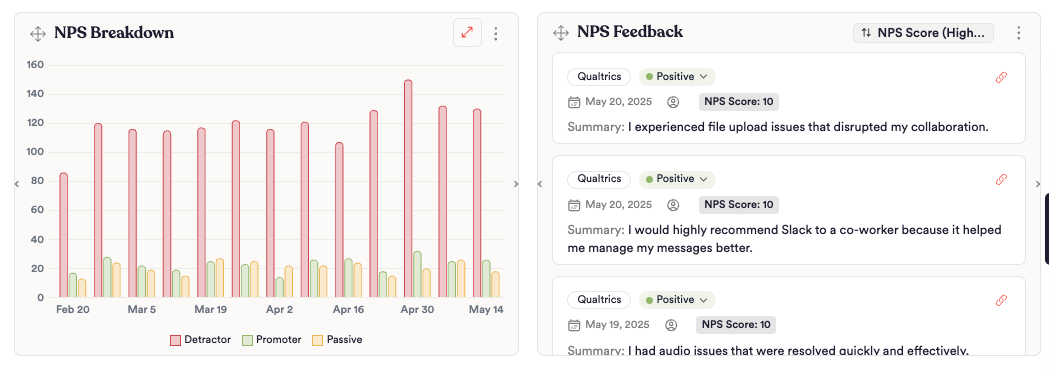
Clustered Column: Ideal for comparing across many categories, like return-related feedback by customer tier or survey results by NPS bucket
Feedback Entry List: See actual customer verbatims alongside your charts without leaving the board
Apply a Color Palette
Define a color palette that matches your brand and apply it across all your charts. Set your palette in the Organization settings page. You can also customize sentiment colors — override the default positive, negative, and neutral colors to fit your reporting style. Right-click any chart legend value to pick a custom color.
New Integrations
Hubspot custom field integration: Connect your data to Hubspot to retrieve interesting account or customer-level metadata
Claap: Import meeting recordings from Claap as Unwrap feedback entries with summarized call transcriptions